Difference between revisions of "Oil Flow - S65 Oil Flow Analysis"
(→BMW Factory 702/703 Bearings) |
(→Overview) |
||
| Line 83: | Line 83: | ||
|- | |- | ||
| − | |Number of cold starts | + | |Number of cold starts |
|240 | |240 | ||
Revision as of 06:34, 25 December 2016
Contents
Test Vehicle
- 2008 BMW M3
- 100% stock engine with 30000 miles
- Stock ECU
- Stock exhaust
Data logging Equipment
- Racelogic Video Vbox Pro, 32-channels engine (ECU) CAN bus.
- Racelogic Mini Input Module. Eight channels A-D conversions, transffered via CAN to Video VBox Pro
- AEM oil pressure sensor. 0-10 BAR; 0-5V analog output to Racelogic Mini Input Module
- Flow Technologies Turbine Oil Flow Sensor. Oil temperature and oil viscosity corrected. Calibrated for Castrol TWS 10W60 oil. 0-15 Gallons Per Minute (GPM); 0-10V analog output to Racelogic Mini Input Module.
Data signals collected and stored
- Timestamp (GMT)
- Vehicle Latitude
- Vehicle Longitude
- Vehicle Elevation (terrain height)
- Vehicle Velocity
- Wheel Speed Sensors (LF, RF, LR, RR)
- BMW internal speedometer
- Odometer
- Brake pedal pressure
- Steering angle
- Fuel gauge
- Vehicle voltage
- Engine RPM
- Throttle position (% open)
- Ambient pressure
- Ambient temperature
- Water temperature
- Oil temperature
- Oil Flow (0-15 GPM)
- Oil Pressure (0-150 PSI)
Testing Methods
Cold Starts
Each cold start was data logged. Data logger was powered up and obtained GPS signal. Once the GPS signal was locked, the data logging was started. After data logging started, the vehicle was started. This allowed the entire starting sequence, low RPMs with the starter, oil pressure, and oil flow to be tracked during the cold start procedure.
Warm Starts
Exact same procedure as cold starts, and for the same purpose. Data logger was powered up and obtained GPS signal. Once the GPS signal was locked, the data logging was started. After data logging started, the vehicle was started.
Everyday driving and hard cornering
Vehicle was driven as a daily driver. 27 miles to work in rush hour traffic each day. Spirited high RPM runs when possible. Hard corning when possible. Grocery getting and fast food runs when possible.
Track day driving
I would have liked to include at least one track day with each set of rod bearings, but that wasn’t possible. At the track day event with the factory 702/703 bearings, the car immediately went into limp mode on the first parade lap. We never were able to fix the issue on that day. It was eventually tracked down to bad seals on the throttle bodies and/or possible loose ground strap (both issues were present). Therefore, the track day never happened for the original 702/703 bearings.
Testing Results
BMW Factory 702/703 Bearings
Overview
| Distance Traveled | Metric (KM) | SAE (Miles) |
|---|---|---|
| Starting Odometer | 50007 | 31073 |
| Ending Odometer | 60548 | 37623 |
| Total | 10541 | 6550 |
| Statistics | |
|---|---|
| Number of cold starts | 240 |
| Number of warm starts | 120 |
| Distance Traveled | 6550 Miles (10541 KM) |
| Data Log Entries (#) | 5268532 |
| Individual data items collected | 142250364 |
Cold Start Analysis
TBD
Oil Pressure Analysis
The factory oil pump is a variable displacement vane (variable pressure) oil pump.
| Metric (BAR) | SAE (PSI) | |
|---|---|---|
| Minimum oil pressure at idle | 1.0 | 14.50 |
| Minimum oil pressure while running | 4.0 – 6.0 | 58.0 – 87.0 |
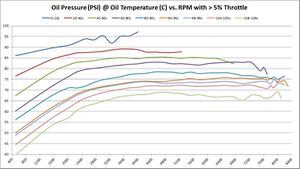
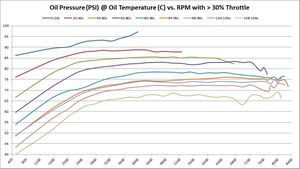
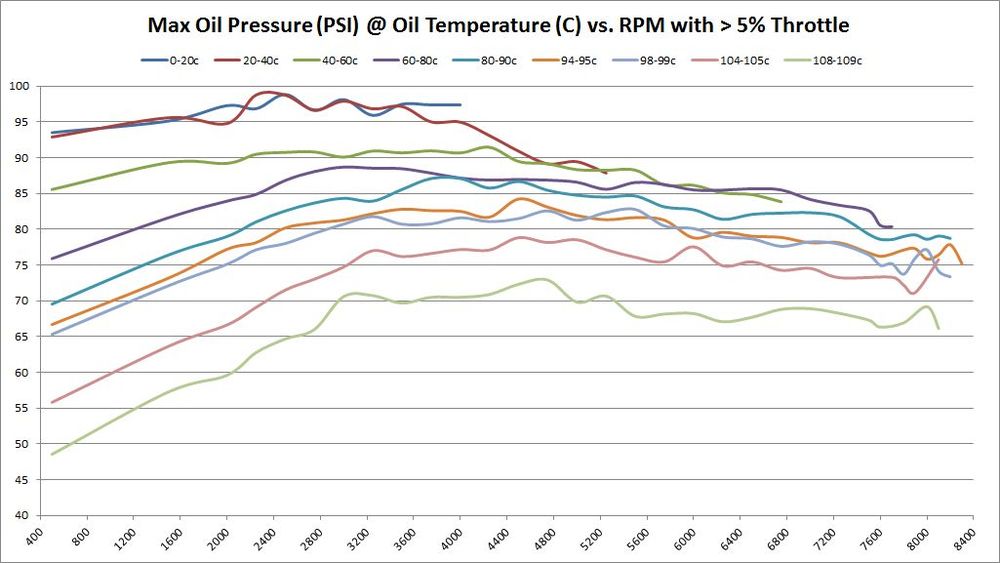
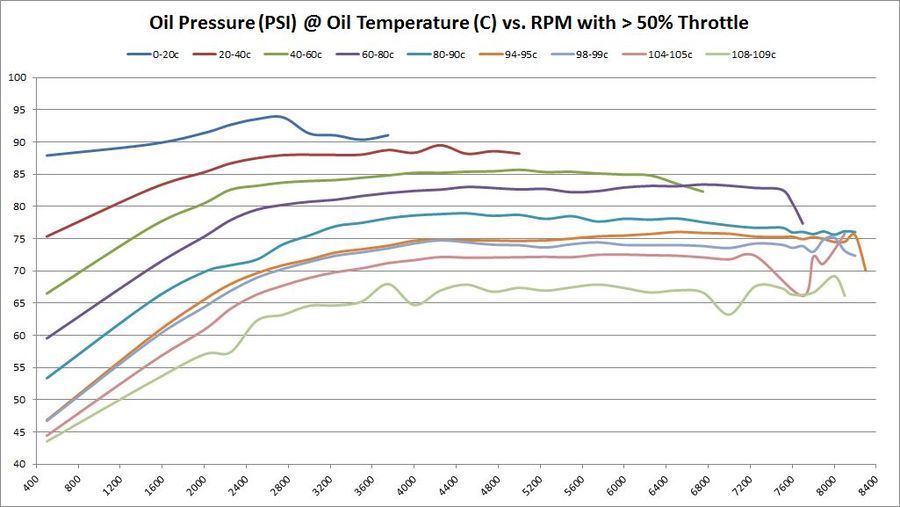
Oil pressure in the S65 varies with temperature. This is expected because as the oil is colder, it is more viscous. As the oil heats up, it becomes less viscous and reduces the pressure. This graph shows the relationship between oil temperature and oil pressure. Each color band represents a different temperature. The temperature (color) bands range from 0-degrees C to 110-degrees C. They are plotted against the RPMs of the engine.
How oil pressure changes with different oil temperatures
These graphs show the oil pressure average of all 5.4 million samples at various temperatures and throttle ranges over RPM. The graphs do change slightly between 5%, 30%, and 50% throttle. The primary graph, 50% throttle is shown here. Click the thumbnails of the other graphs to enlarge each one.
| |
If minimum oil operating oils pressure is 4-BAR (58 PSI), then it’s interesting to see on this graph at what RPM that goal is achieved. Again, that answer depends on oil temperature – as oil is more viscous and produces more pressure the colder it is. As these graphs show, the minimum operating oil pressure at minimum RPM appears to be right around 2500; that’s where we get minimum 4-bar pressure regardless of oil temperature.
Absolute minimum oil pressure with different oil temperatures
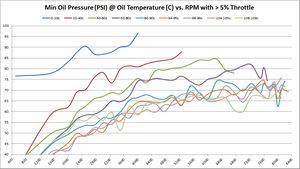
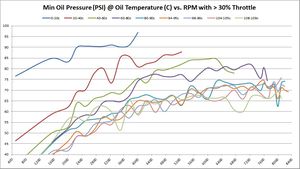
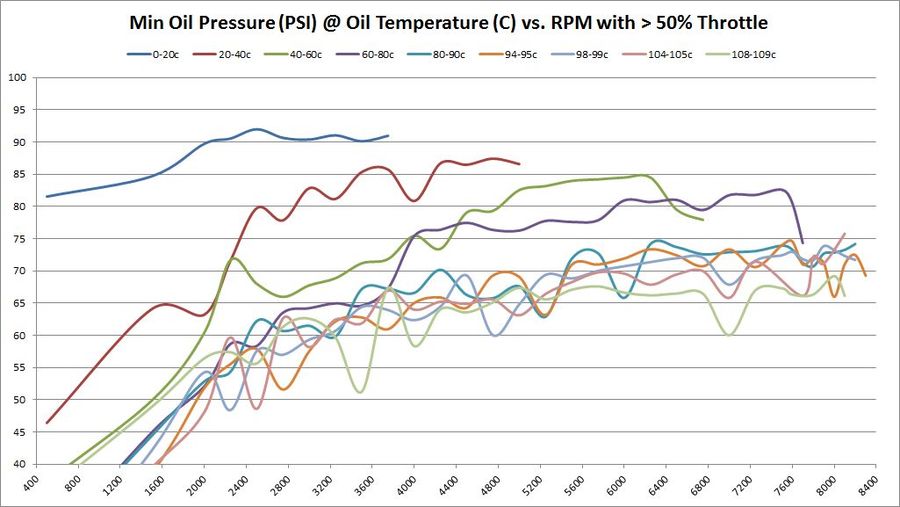
So far, the data being shown are averages across millions of samples. But what about absolute minimum and absolute maximums?
These are the same set of graphs as above, but show the absolute minimums. The absolute minimums are the minimum oil pressures collected across all temperature ranges. They are graphed here to show just how low the pressure can go. Some of this may have been observed during hard cornering (more on that later). So it's hard to draw any hard conclusions based on these graphs. They are offered for informational purposes only to let the reader draw their own conclusions.
| |
Absolute maximum oil pressure with different oil temperatures
Conversely, the final graph in this set shows the absolute maximums. There's no need to show maximum graphs for different throttle levels because the maximums are absolute and every graph would be the same.
Oil Flow Analysis
TBD
Summary Oil Pressure and Oil Flow
TBD
